
Earthquake Activity in Turkey: 3D City-Level Visualization
An interactive 3D web application displaying all M ≥ 4.5 earthquakes in Turkey over the past year. Includes city-level statistics, temporal filters, and fault lines from official geological maps. Built with Cesium.js, PostGIS, FME, and QGIS.
Visit website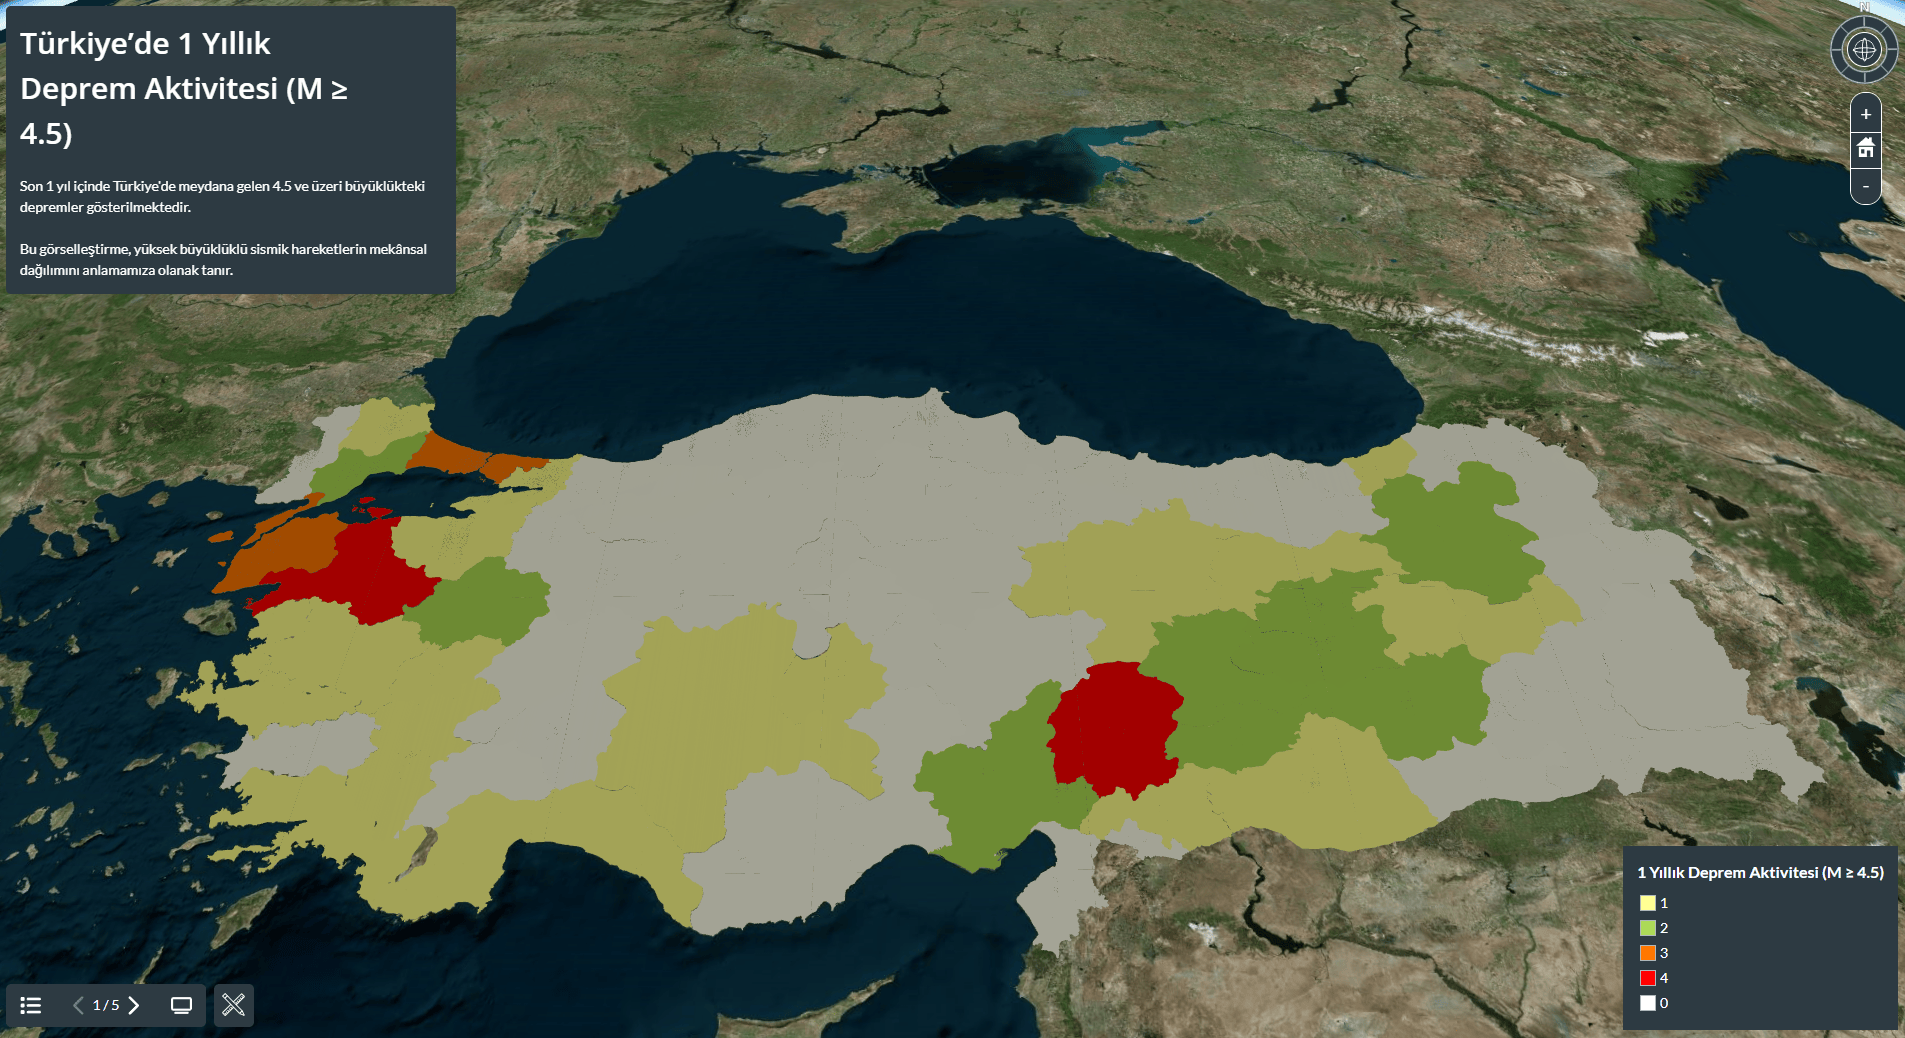
The problem
Earthquake risk in Turkey is both geographically widespread and socially critical. Yet, accessible tools to explore seismic data in a meaningful, interactive way remain limited. Existing platforms often lack localized granularity, temporal filtering, and visual clarity. This project addresses that gap by enabling users to explore all M ≥ 4.5 earthquakes in Turkey over the past year — city by city — through an interactive 3D interface powered by Cesium.
Earthquake Visualization Framework
The foundation of this project was a modular and scalable 3D visualization system. Using Cesium Stories, PostgreSQL + PostGIS, and CityGML-based geospatial data, I built an architecture that allows filtering earthquake events by city and time range. This design supports real-time visual exploration and can be extended with additional datasets such as population density or building risk levels.

Data sources & Methodology
Transparency and accuracy were critical in this project. I compiled earthquake and fault line data from official sources including MTA, EMSC, and USGS. Each dataset was cleaned, transformed, and spatially aligned using tools like QGIS and FME. These steps were thoroughly documented to ensure reproducibility and data integrity for future updates or integrations.

Spatial Interaction
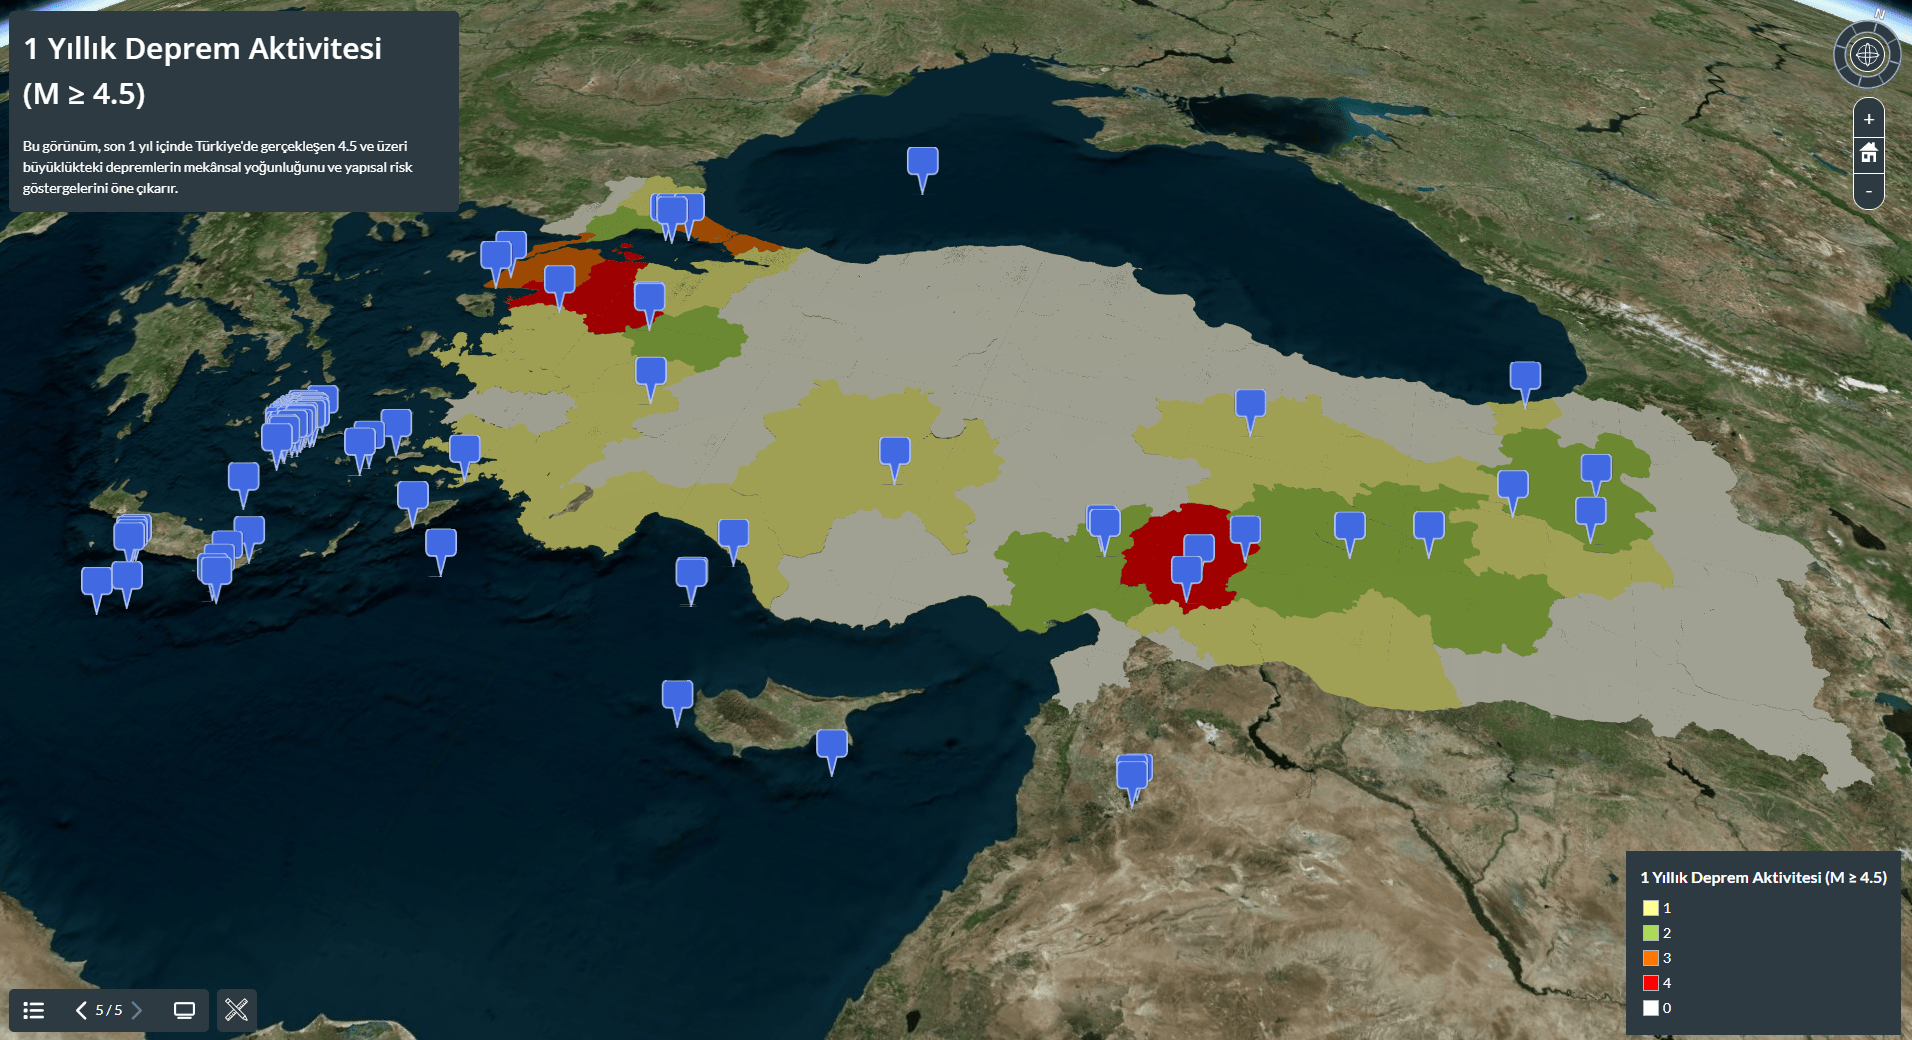
I leveraged Cesium Stories to create an interactive 3D experience where users can freely explore earthquake activity across Turkey. Each city polygon was enriched with metadata using CityGML, allowing users to understand seismic trends spatially. Fault lines from MTA’s official geological maps were overlaid, providing accurate tectonic context. Temporal filters (week, month, 6 months, year) and color-coded intensity made it easier for users to visually interpret changes over time.

Smart City Layers
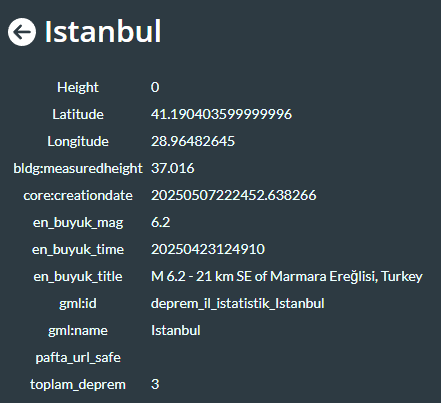
Each city in the visualization is more than just a shape — it's a smart data layer. Using CityGML, urban boundaries are enriched with metadata like earthquake frequency, magnitude averages, and last recorded events. Users can interactively navigate the 3D globe, click on individual cities, and surface detailed seismic insights. This allows for informed, localized risk interpretation — whether you're a citizen, researcher, or policymaker.
Expandable Data Infrastructure
The core structure of this 3D web application is designed to scale. Thanks to the modular use of Cesium Stories, CityGML, and PostgreSQL + PostGIS, the system supports adding new data layers — like real-time seismic feeds, updated fault lines, or socio-economic overlays — with minimal effort. The goal is not only to visualize data but to enable researchers, urban planners, and decision-makers to plug in what matters most to them and see the impact immediately.
Next-Generation Seismic Exploration
The architecture of this 3D web app enabled the creation of immersive and informative seismic data experiences. By integrating interactive models of Turkey, earthquake zones can be visualized with high clarity — enabling both experts and the public to explore patterns, density, and historical events with ease.
Bringing 3D into Seismic Analysis
The Cesium-based Earth component allows full support for importing custom geographic data. For this project, CityGML-formatted city boundaries were visualized and layered with enriched metadata, allowing users to explore localized earthquake stats and risk profiles interactively.
Exploration & Interaction
Users can pan, zoom, and rotate the globe to freely navigate earthquake activity across Turkey. Interactive labels guide attention to seismic hotspots and fault lines, creating a clear and intuitive spatial understanding of risk zones.
Animation
Camera transitions between predefined city views and tectonic regions bring fluid storytelling to seismic activity. Without relying on external animation tools, each scroll-triggered movement helps users understand the spatial and geological context more effectively.
Project outcomes
Ultimately, the project was independently developed and published as a 3D geospatial visualization on Cesium to provide city-level insights into seismic activity and fault lines across Turkey.